Image Details
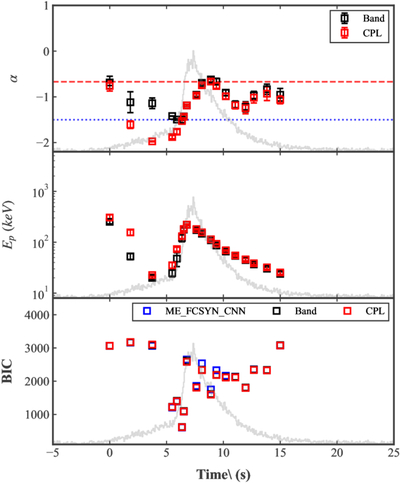
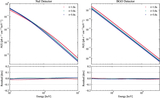
Caption: Figure 8.
Comparison between the empirical Band/CPL functions and the ME_FCSYN_CNN model. The top panel shows the temporal evolution of the low-energy photon index α obtained from the Band and CPL fits. The red dashed and blue dotted lines denote α = −2/3 and α = −3/2, respectively. The middle panel shows the evolution of the spectral peak energy Ep. The bottom panel shows the BIC values of the ME_FCSYN_CNN, Band, and CPL models. The gray curve in each panel shows the prompt-emission light curve for reference.
Other Images in This Article
Copyright and Terms & Conditions
© 2026. The Author(s). Published by the American Astronomical Society.
Copyright ©
2026 Astronomy Image Explorer. All Rights Reserved.