Image Details
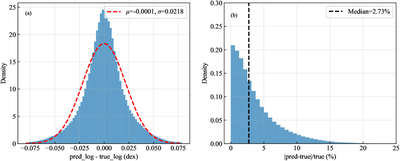
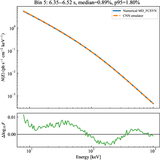
Caption: Figure 4.
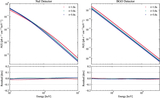
Validation statistics of the CNN spectral emulator on the independent test set. Left: distribution of logarithmic residuals, defined as ﹩{\mathrm{log}}_{10}({F}_{{\rm{CNN}}}/{F}_{{\rm{num}}})﹩, showing negligible systematic bias and a narrow scatter around zero. Right: distribution of relative errors, with a median of ∼2.73% and a 95th-percentile value of ∼11.22%.
Other Images in This Article
Copyright and Terms & Conditions
© 2026. The Author(s). Published by the American Astronomical Society.
Copyright ©
2026 Astronomy Image Explorer. All Rights Reserved.