Image Details
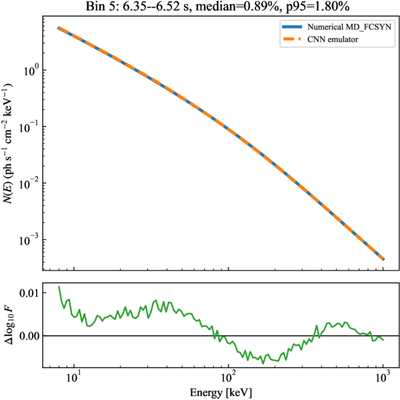
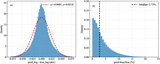
Caption: Figure A1.
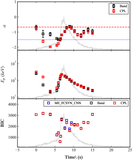
Comparison between the CNN-emulated spectrum and the original numerical spectrum at the fitted parameters of the high-flux peak interval 6.35–6.52 s. The upper panel shows the two spectra, and the lower panel shows the logarithmic residual ﹩{\rm{\Delta }}{\mathrm{log}}_{10}F={\mathrm{log}}_{10}{F}_{{\rm{CNN}}}-{\mathrm{log}}_{10}{F}_{{\rm{num}}}﹩. The median and 95th-percentile relative differences are 0.89% and 1.80%, respectively.
Other Images in This Article
Copyright and Terms & Conditions
© 2026. The Author(s). Published by the American Astronomical Society.
Copyright ©
2026 Astronomy Image Explorer. All Rights Reserved.