Image Details
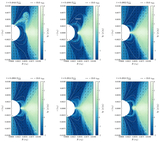
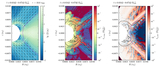
Caption: Figure 22.
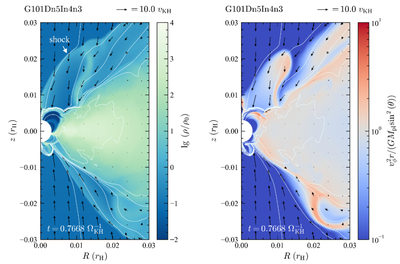
Snapshot of simulation G101Dn5In4n3 at ﹩t=0.7668\,{{\rm{\Omega }}}_{{\rm{KH}}}^{-1}﹩. The left panel depicts the density distribution in color scale, with the shock surface above the CPD upper surface—characterized by a distinct density jump—indicated. The right panel illustrates the ratio of centrifugal to gravitational forces in the R-direction (absolute value), given by ﹩{v}_{\phi }^{2}r/(G{M}_{{\rm{pl}}}{\sin }^{2}(\theta ))﹩, also in color scale. In both panels, the poloidal velocity field is represented by black arrows, and magnetic field lines are indicated by solid white lines. The scale of the poloidal velocity is shown at the top right of each panel. The magnetic field lines are depicted by the contours of the poloidal magnetic flux at several specific levels.
Other Images in This Article
Show More
Copyright and Terms & Conditions
© 2026. The Author(s). Published by the American Astronomical Society.