Image Details
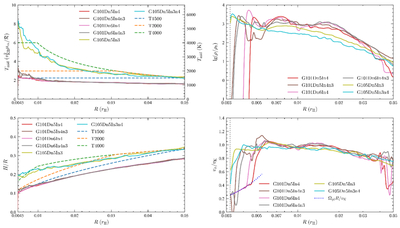
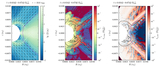
Caption: Figure 20.
CPD midplane properties. Radial profiles of the midplane temperature (Tmid; top left), aspect ratio (bottom left), midplane density (top right), and rotational velocity normalized by the local Keplerian velocity (vϕ/vK; bottom right) are shown. Solid lines show the results from the selected simulations at their termination times (see Table 1). Dashed lines correspond to the profiles derived based on the analytic temperature prescription given by Equation (12), with labels T1500, T2000, and T4000 denoting analytic models with maximum temperatures set to ﹩{T}_{{\rm{\max }}}=1500\,{\rm{K}}﹩, 2000 K, and 4000 K, respectively (see Equation (12)). Vertical dotted lines in the right panels mark the outer boundary of the damping layer (r = 0.0032 rH). The blue dotted line in the bottom-right panel shows the rotational velocity of planet-corotating gas normalized by the local Keplerian velocity.
Other Images in This Article
Show More
Copyright and Terms & Conditions
© 2026. The Author(s). Published by the American Astronomical Society.