Image Details
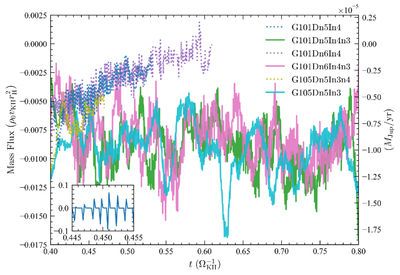
Caption: Figure 19.
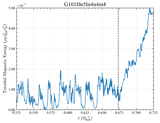
Mass flux across the planetary surface (evaluated at r = 0.00334 rH) as a function of time for selected simulations. Solid and dotted lines correspond to simulations with confined and inflating magnetospheres, respectively. The dotted lines terminate when the inflating magnetospheres cross the radial outer boundary of the simulation domain. All curves are smoothed using a sliding-window average over a time interval ﹩{\rm{\Delta }}t=0.01\,{{\rm{\Omega }}}_{{\rm{KH}}}^{-1}﹩. The inset at the bottom-left corner displays the instantaneous mass flux from the representative simulation G101Dn5In4 over a short time interval, with its horizontal and vertical axes sharing the same physical quantities (and units) as the x-axis and left y-axis of the main plot.
Other Images in This Article
Show More
Copyright and Terms & Conditions
© 2026. The Author(s). Published by the American Astronomical Society.