Image Details
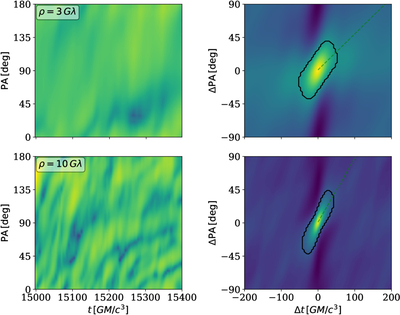
Caption: Figure 2.
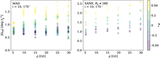
A 400 tg window of a (u, v) cylinder plots (left) and the autocorrelations (right) from the fiducial Sgr A* model (MAD, a* = 0.5, i = 30∘, Rhigh = 160), measured at ρ = 3Gλ (top) and 10Gλ (bottom). The bounded region of the autocorrelation ξ > ξcrit is surrounded by a black contour, and the measured pattern speed ΩVA is marked by the dashed green line. Notice the size and slope of the central correlated peak changes with varying ρ.
Other Images in This Article
Copyright and Terms & Conditions
© 2026. The Author(s). Published by the American Astronomical Society.
Copyright ©
2026 Astronomy Image Explorer. All Rights Reserved.