Image Details
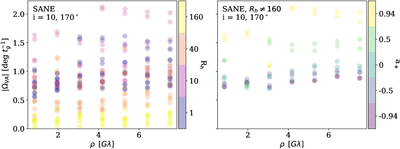
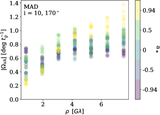
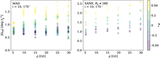
Caption: Figure 5.
Measured (u, v) pattern speeds as a function of baseline length, shown for all SANE face-on models (i = 10∘, 170∘). Color corresponds to the electron temperature distribution function (left) and black hole spin (right). To make the spin dependence clearer, we have not plotted Rhigh = 160 on the right plot. SANE models demonstrate a strong dependence on Rhigh and a weaker dependence on a*.
Other Images in This Article
Copyright and Terms & Conditions
© 2026. The Author(s). Published by the American Astronomical Society.
Copyright ©
2026 Astronomy Image Explorer. All Rights Reserved.