Image Details
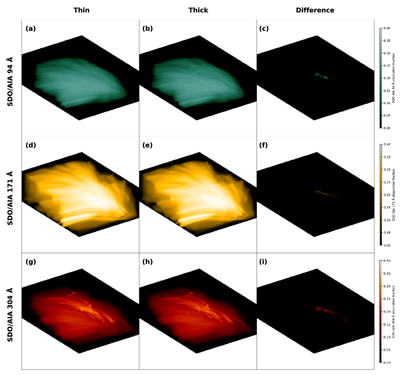
Caption: Figure 4.
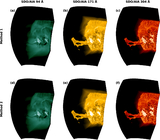
Synthesized images of MURaM coronal rain data provided by Z. Lu et al. (2024). This figure illustrates the optically thin and thick radiation at 94, 171, and 304 Å. The absorption fraction is calculated as (Ithin − Ithick)/Ithin. In the 94 and 171 Å wave bands, only optically thick synthesized images reveal the coronal rain structures. In the 304 Å wave band, both optically thin and thick synthesized images can reveal the coronal rain structures.
Other Images in This Article
Copyright and Terms & Conditions
© 2026. The Author(s). Published by the American Astronomical Society.
Copyright ©
2026 Astronomy Image Explorer. All Rights Reserved.