Image Details
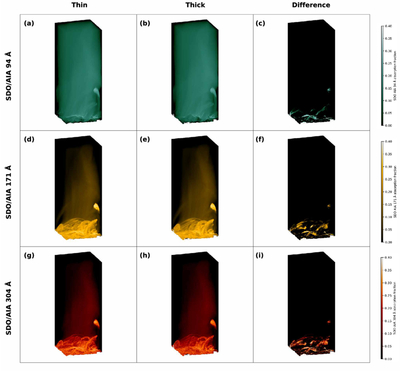
Caption: Figure 3.
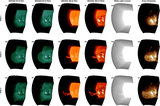
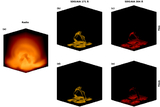
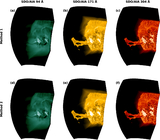
Synthesized images of MURaM (F. Chen et al. 2022) example data provided by C. Wang et al. (2023) in the EUV wave bands. This figure illustrates the optically thin and thick radiation at 94, 171, and 304 Å. To quantify the absorption effects, we present the relative difference (the absorption fraction), defined mathematically as (Ithin − Ithick)/Ithin, accompanied by corresponding color bars. This region is part of flare ribbons associated with a confined eruption. The structures in the lower corona appear more realistic due to the absorption.
Other Images in This Article
Copyright and Terms & Conditions
© 2026. The Author(s). Published by the American Astronomical Society.
Copyright ©
2026 Astronomy Image Explorer. All Rights Reserved.