Image Details
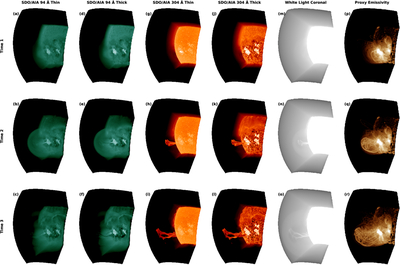
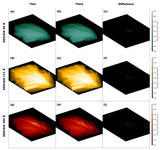
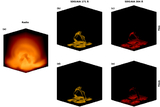
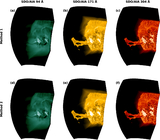
Caption: Figure 5.
Synthesized images of spherical data using Method 2. Panels (a)–(l) show synthesized images in EUV wave bands. It is crucial to consider absorption in EUV wave bands, especially for filaments. Panels (m)–(o) demonstrate optically thin white-light coronal radiation. Panels (p)–(r) depict the magnetic configuration using the pseudo-radiation model.
Other Images in This Article
Copyright and Terms & Conditions
© 2026. The Author(s). Published by the American Astronomical Society.
Copyright ©
2026 Astronomy Image Explorer. All Rights Reserved.