Image Details
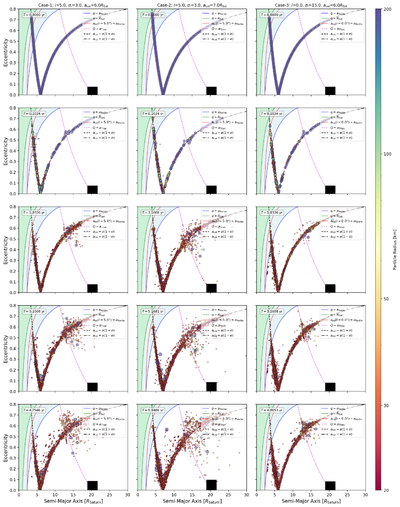
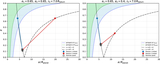
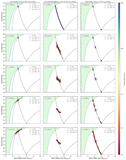
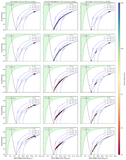
Caption: Figure 3.
Evolution of the debris distribution in the a–e plane obtained from the direct N-body simulations for the three representative initial conditions summarized in Table 1. Different columns correspond to different initial conditions, and different rows show snapshots at different times. The black curves indicate the original V-shaped constraint curves, acol = a(1 − e) and acol = a(1 + e), corresponding to debris particles that initially share a common periapsis or apoapsis at the collision radius acol. The blue and red curves mark the conditions q = aRoche and aeq = aRoche, respectively, where q = a(1 − e) is the periapsis distance and aeq is the equivalent circular radius. Green curves indicate q = RSat. The color and size of each point indicates the fragment size. Titan is plotted as a black square.
Other Images in This Article
Copyright and Terms & Conditions
© 2026. The Author(s). Published by the American Astronomical Society.