Image Details
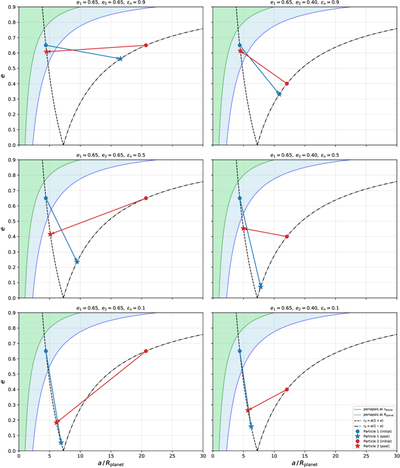
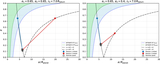
Caption: Figure 2.
Post-collision orbital evolution of two particles in the a–e diagram. Each panel shows the constraint curves for a collision at acol = 7 Rplanet: the apoapsis constraint (e = acol/a − 1; left branch) and the periapsis constraint (e = 1 − acol/a; right branch). The green- and blue-shaded regions indicate orbits with periapsis below the planetary surface and the Roche limit, respectively. Blue and red symbols trace the successive positions of particle 1 (initially at apoapsis) and particle 2 (initially at periapsis), respectively. The left column adopts e1 = e2 = 0.65, while the right column adopts e1 = 0.65 and e2 = 0.40. From top to bottom, the coefficient of restitution decreases: εn = 0.9, 0.5, and 0.1. For high εn, particle 1 crosses from the apoapsis curve to the periapsis curve, whereas for low εn, particles remain on their respective constraint curves and converge toward the circular orbit at (acol, 0).
Other Images in This Article
Copyright and Terms & Conditions
© 2026. The Author(s). Published by the American Astronomical Society.