Image Details
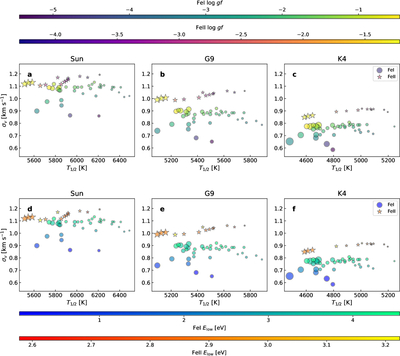
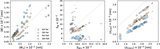
Caption: Figure 7.
Standard deviation of the line center of gravity as a function of RV-weighted line-formation temperature. Each panel shows σCOG as a function of the RV-weighted formation temperature T1/2, defined from the cumulative disk-center (μ = 1) contribution functions and weighted across the line profile by ﹩{w}_{\lambda }\propto \left|d{f}_{\lambda }/dv\right|﹩ (see Section 3.2). Symbols denote species (circles: Fe I; stars: Fe II). The three columns correspond to the Sun, G9, and K4 models, respectively. Top row: points are colored by the lower-level excitation potential Elow (shared horizontal color bars above the top row; Fe I and Fe II shown separately). Bottom row: same layout, but points are colored by oscillator strength ﹩\mathrm{log}gf﹩. Marker sizes are proportional to the line equivalent width W (very weak lines excluded; W > 10−3 nm). Because the RV-weighting emphasizes the line flanks and we use disk-center intensities in the blue (400–450 nm), T1/2 is weighted toward flank-forming layers, i.e., photospheric depths intermediate between the line core and the continuum, rather than toward the highest, coolest core-forming layers. As in Figure 3, σv values are local disk-center scatter metrics computed from a single simulation snapshot at μ = 1, not disk-integrated stellar quantities.
Other Images in This Article
Copyright and Terms & Conditions
© 2026. The Author(s). Published by the American Astronomical Society.