Image Details
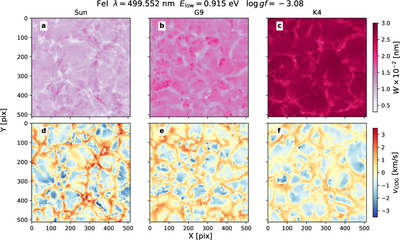
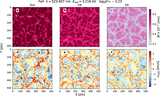
Caption: Figure 4.
Spatial maps of line strength and COG velocity for an Fe I line at disk center. The maps are computed for one snapshot each of the Sun, G9, and K4 simulations, using vertical rays at μ = 1. Each pixel corresponds to one vertical column of the 3D cube. The top row shows the equivalent width, and the bottom row shows the COG velocity, for the same Fe I transition. The maps illustrate how the line strength and convective line shifts change toward cooler spectral type.
Other Images in This Article
Copyright and Terms & Conditions
© 2026. The Author(s). Published by the American Astronomical Society.
Copyright ©
2026 Astronomy Image Explorer. All Rights Reserved.