Image Details
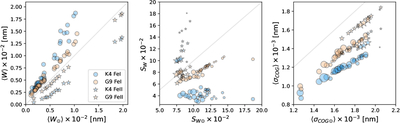
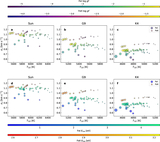
Caption: Figure 6.
Comparison of solar line sensitivities with those in the G9 and K4 models. Each point compares a given line’s granulation sensitivity in the G9 or K4 models (vertical axes) to its value in the solar model (horizontal axes). Symbols and colors distinguish ionization stage (Fe I or Fe II) and spectral type, as indicated in the legend. The gray line marks equality. Left: mean equivalent width 〈W〉. Middle: fractional equivalent-width variability SW. Right: COG wavelength scatter 〈σCOG〉. In the middle and right panels, marker sizes are proportional to the line equivalent width W (very weak lines excluded; W > 10−3 nm).
Other Images in This Article
Copyright and Terms & Conditions
© 2026. The Author(s). Published by the American Astronomical Society.