Image Details
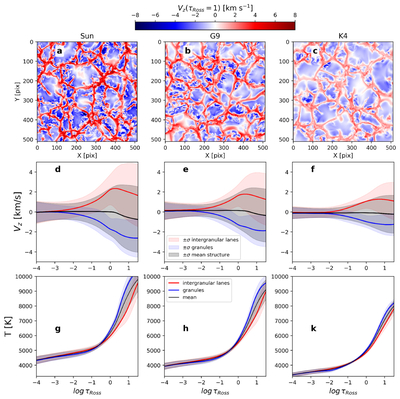
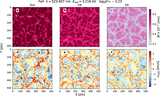
Caption: Figure 1.
MURaM simulations used in the analysis. Top: maps of vertical velocity Vz at the continuum optical-depth unity surface (τRoss = 1 surface) for the Sun (left), G9 (middle), and K4 (right). We define granules and intergranular lanes by the sign of the vertical velocity VZ; granules have VZ < 0 (upflows, toward the observer), and intergranular lanes have VZ > 0 (downflows, away from the observer). Middle: horizontally averaged VZ versus ﹩\mathrm{log}{\tau }_{{\rm{Ross}}}﹩ for granules (blue), intergranular lanes (red), and the entire simulated domain mean (black); shading shows the 1σ dispersion ﹩{\sigma }_{{V}_{Z}}﹩ (we define ﹩{\sigma }_{{V}_{z}}({\tau }_{{\rm{Ross}}})﹩ as the standard deviation of the vertical velocity Vz on the ﹩{\tau }_{{\rm{Ross}}}={\rm{const}}﹩ surface) of the vertical velocity. Bottom: horizontally averaged temperature profiles for granules (blue), intergranular lanes (red), and the entire simulated domain mean (black) versus ﹩\mathrm{log}{\tau }_{{\rm{Ross}}}﹩. For panels (d)–(k), averages at each ﹩\mathrm{log}{\tau }_{{\rm{Ross}}}﹩ are computed along the corresponding constant optical depth surface. Toward cooler spectral types, the granulation pattern persists but with reduced amplitude.
Other Images in This Article
Copyright and Terms & Conditions
© 2026. The Author(s). Published by the American Astronomical Society.