Image Details
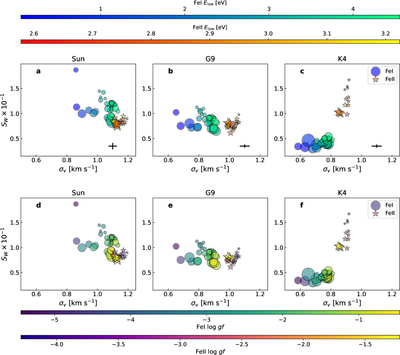
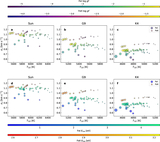
Caption: Figure 3.
Dependence of Fe I and Fe II line sensitivity to granulation on effective temperature. Each panel shows, for individual lines, their sensitivity to granulation as quantified by the RV-scaled line-shift scatter σv on the x-axis and the fractional equivalent-width scatter SW on the y-axis. Symbols denote ionization stage (circles: Fe I; stars: Fe II), and marker sizes are proportional to the line equivalent widths. The three columns correspond to the Sun, G9, and K4 models, respectively. Top row: points are colored by the lower-level excitation potential Elow (shared horizontal color bars above the top row; Fe I and Fe II shown separately). Bottom row: same layout, but points are colored by oscillator strength ﹩\mathrm{log}gf﹩ (shared horizontal color bars below the bottom row). Black crosses in the top row indicate the characteristic cube-to-cube fluctuations in (σv SW) estimated from five independent simulation cubes; these fluctuations reflect changes in the granule/intergranule area coverage between cubes. We exclude extremely weak lines by requiring W > 10−3 nm to avoid numerical noise and continuum-placement uncertainty in spaxel-by-spaxel equivalent-width and COG measurements, which otherwise dominate the inferred scatter for vanishingly small line depths. The plotted σv and SW values are local disk-center scatter metrics computed from a single simulation snapshot at μ = 1, not disk-integrated stellar quantities; in particular, σv should not be interpreted as disk-integrated stellar RV jitter.
Other Images in This Article
Copyright and Terms & Conditions
© 2026. The Author(s). Published by the American Astronomical Society.