Image Details
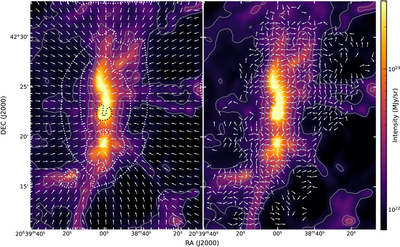
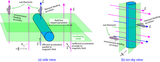
Caption: Figure 4.
The left panel depicts the direction of the gravitational acceleration field ﹩{{\boldsymbol{g}}}_{{\rm{pos}}}﹩ in the form of white vectors. The magnitude of ﹩{{\boldsymbol{g}}}_{{\rm{pos}}}﹩ is indicated by dotted contours drawn at accelerations of [0.5, 1, 5, 10, 50] · 10−10 m s−2. The right panel depicts the direction of intensity gradients ﹩{\boldsymbol{\nabla }}I﹩ obtained from HAWC+ data, drawn in locations where the uncertainty in the position angle of ﹩{\boldsymbol{\nabla }}I﹩ is ≤15°. Vectors for ﹩{{\boldsymbol{g}}}_{{\rm{pos}}}﹩ are spaced by 46″. Vectors for ﹩{\boldsymbol{\nabla }}I﹩ are spaced by 32″. Gray contours and the false color background are taken from Figure 1 (right) and indicate Herschel H2 column densities.
Other Images in This Article
Copyright and Terms & Conditions
© 2026. The Author(s). Published by the American Astronomical Society.