Image Details
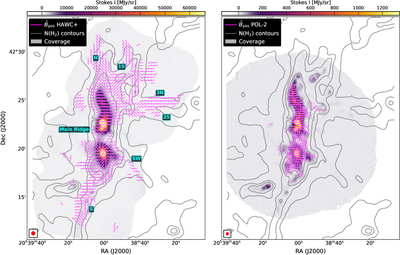
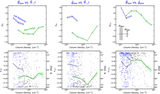
Caption: Figure 2.
Comparison of magnetic field orientation inferred from polarized dust emission observed with SOFIA/HAWC+ at 214 μm (left) and JCMT/POL-2 at 850 μm (right) for p/σp ≥ 3.0 (T.-C. Ching et al. 2022). The background colorscale images show the respective Stokes I intensities. Black contours in both panels indicate Herschel H2 column densities, as in Figure 1. The pseudo-vectors show the plane-of-sky magnetic field orientation (﹩{\hat{{\boldsymbol{B}}}}_{{\rm{pos}}}﹩). Gray regions indicate the extents of the respective sky mappings for polarization. Subfilament names from M. Hennemann et al. (2012) are labeled on the HAWC+ panel. Filament F1N from that study lies outside the mapped region and is not shown. Both panels are displayed on similar spatial scales, to highlight differences in coverage and sensitivity between the two datasets.
Other Images in This Article
Copyright and Terms & Conditions
© 2026. The Author(s). Published by the American Astronomical Society.