Image Details
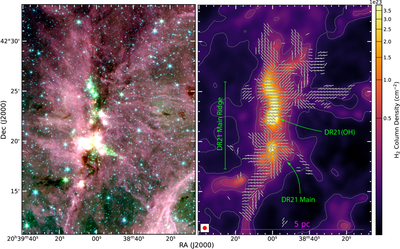
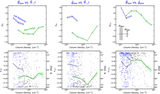
Caption: Figure 1.
Left: Spitzer three-color image of the DR21 complex (IRAC1 is shown in blue, IRAC2 in green, and IRAC4 in red), rendered on the same pixel grid as the column density map in the right panel. Right: Plane-of-sky magnetic field orientation inferred from HAWC+ 214 μm polarization (rotated by 90°), overlaid on the Herschel-derived H2 column density map of R. Pokhrel et al. (2020) (colorscale). Contours mark H2 column densities of 1, 2, 3, and 6 × 1022 cm−2. Pseudo-vectors are spaced by ﹩18\mathop{.}\limits{^{\prime\prime} }2﹩ (4 pixels), approximately matching the ﹩20\mathop{.}\limits{^{\prime\prime} }3﹩ resolution of the smoothed HAWC+ data, which is also illustrated in the lower left corner.
Other Images in This Article
Copyright and Terms & Conditions
© 2026. The Author(s). Published by the American Astronomical Society.