Image Details
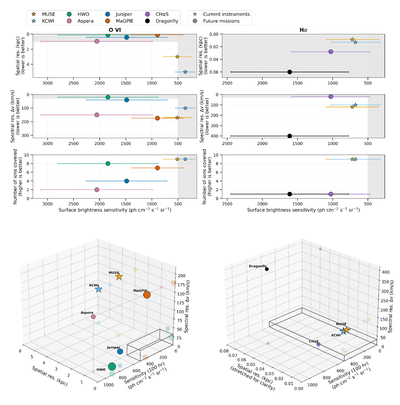
Caption: Figure 14.
Comparison of current (stars) and future (circles) instruments designed/suitable for CGM studies in emission across multiple performance planes. The left column shows performance for O VI, while the right column shows Hα, including only the instruments capable of observing each line. Sensitivity (photons s−1 cm−2 sr−1) is shown on the x-axis of the three 2D panels. First panel: spatial resolution vs. sensitivity highlights mapping capability. Second panel: kinematic resolution vs. sensitivity illustrates kinematic resolving power. Third panel: number of emission lines covered (from the list considered in this study) vs. sensitivity shows multiphase detection capability. Grey shaded regions mark regimes of particularly strong performance (sensitivity ≲500 photons s−1 cm−2 sr−1 combined with spatial resolution < 1 kpc, kinematic resolution < 30 km s−1). Last panel: a 3D view combines all three axes, spatial resolution, sensitivity (100 hr), and kinematic resolution, with marker size proportional to the number of emission lines covered, providing a holistic comparison of current and future instruments. The gray box corresponds to the shaded regions in the 2D panels. These performance thresholds serve as a guide for the design of next-generation instruments.
Other Images in This Article
Show More
Copyright and Terms & Conditions
© 2026. The Author(s). Published by the American Astronomical Society.