

Image Details
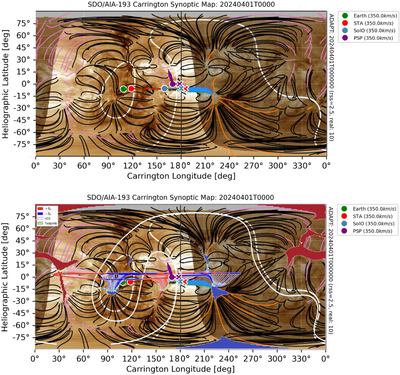
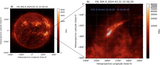
Caption: Figure 10.
Top: mapping of Earth, STEREO-A (STA), Solar Orbiter (SolO), and PSP to high-coronal footpoints at the assumed 2.5 Rs source surface (colored ×'s based on Solar MACH). The blue swath extending from the blue × (SolO) indicates the estimated mapping into the low corona at the time of event onset. Black lines represent closed field within the 2.5 Rs boundary assumed by the model for the high-coronal mapping. Pink (orange) lines represent field lines that cross the 2.5 Rs boundary and have inward (outward) radial components, respectively. The loci of the HCS is shown in white. Bottom: same plot, with estimated PSP low-coronal connections (red indicates antisunward radial component of B; blue indicates sunward). Two slightly different HCS loci are overlain in the panel as they were derived at slightly different times (the first was at the time of the event shown in the top panel, and the second at PSP perihelion). Note that the HCS location is effectively identical in the vicinity of the PSP-mapped connection location and is therefore insensitive to the epoch used. Estimated PSP low-coronal footprints are shown in light green.
Other Images in This Article
Copyright and Terms & Conditions
© 2026. The Author(s). Published by the American Astronomical Society.

