

Image Details
Caption: Figure 5.
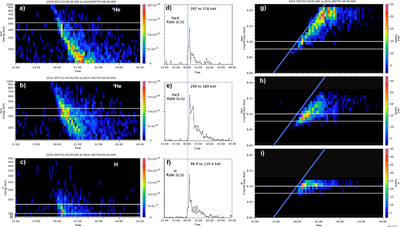
(a)–(c) Energy spectrograms (in counts s–1) for 4He, 3He, and H, respectively, binned at 5 minute resolution. Counts s–1 are used to limit the dynamic range in the color bar for improved visibility. Horizontal integrations of the spectrograms over the energy range between the white lines (corresponding to the same energy per nucleon, i.e., velocity for each species) are shown in panels (d)–(f), using the same linear vertical scaling as the color bars for (a)–(c). These profiles show that the 3He distribution remains near its maximum for more than twice as long as the corresponding enhancements in 4He and H. The vertical blue line shows that the onset of the 3He increase is delayed by 5–10 minutes relative to the onset of H and 4He. Panels (g)–(i) show counts for each species vs. the quantity ﹩1/\sqrt{\text{energy per nucleon}}﹩, which is proportional to 1/velocity. The diagonal blue line represents a fit by eye to the slope of the leading edge of the 4He distribution. The time at which this line intersects the horizontal axis indicates the initial injection time of the event at the Sun. The hydrogen distribution (panel (i)) is in close agreement with this inferred injection time. The 3He distribution appears to lag behind both the H and 4He injection times by ∼10–20 minutes, depending on energy.
Other Images in This Article
Copyright and Terms & Conditions
© 2026. The Author(s). Published by the American Astronomical Society.

