Image Details
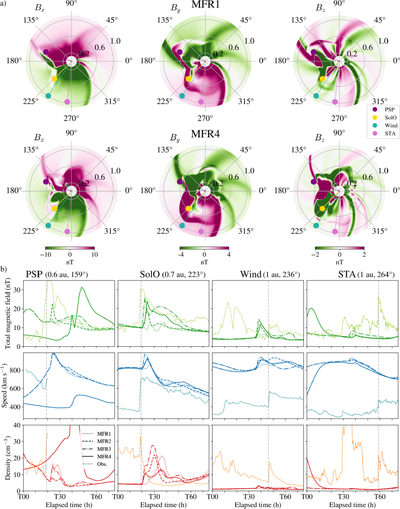
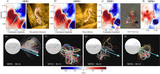
Caption: Figure 7.
(a) Slices of the magnetic field components at latitude 6∘ at 34 hr into the MFR1 and MFR4 simulations. The dots indicate the heliospheric position of STA (pink), Wind (teal), SolO (yellow), and PSP (purple). (b) Comparison of simulation parameters and observed in situ data at different heliospheric locations. From left to right: PSP, SolO, Wind, and STA measurements of total magnetic field (top panels), solar wind speed (middle panels), and solar wind density (bottom panels). The x-axis expresses the time elapsed from the initiation of the eruption in hours. The gray vertical dashed lines indicate the time of arrival in the observed data.
Other Images in This Article
Copyright and Terms & Conditions
© 2026. The Author(s). Published by the American Astronomical Society.