Image Details
Caption: Figure 1.
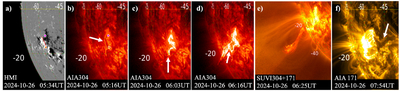
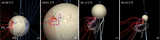
Pre-eruptive configuration and early eruption of the October event. (a) HMI magnetogram of AR 13873. The red dashed line marks the PIL. The magenta (orange) dot indicates the northern (southern) footpoint. (b) pre-eruption filament observed in AIA 304 at 05:16 UT (white arrow). Footpoints are marked as in panel (a). (c) First activation at 06:03 UT, with flare ribbon signatures. The southern extension of the ribbons is indicated by the white arrow. d) Eruptive filament at 06:16 UT, highlighted by the white arrow. (e) Early eruption at 06:25 UT observed by SUVI, shown as a composite of the 304 and 171 Å channels to show the core of the eruption and the ambient corona. (f) Post-eruptive arcade observed in AIA 171 at 07:54 UT. The white arrow indicates the location of the dimming associated with the northern footpoint. An animated version of this figure shows the evolution of the eruption in AIA 304, SUVI 304, SUVI 131, and SUVI 171 images from 05:00 to 09:00 UT. The real-time duration of the animation is 14 s.
(An animation of this figure is available in the online article.)
(An animation of this figure is available.)
The video/animation of this figure is available in the online journal.
Other Images in This Article
Copyright and Terms & Conditions
© 2026. The Author(s). Published by the American Astronomical Society.