Image Details
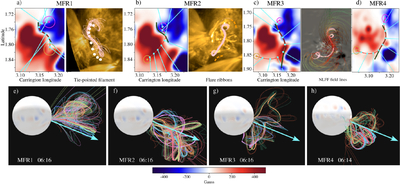
Caption: Figure 4.
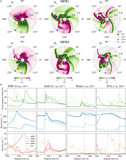
Modeling of the MFRs. For each MFR, the top left panels show the magnetogram and the segment of the PIL (solid green line) over which the MFR was built. The orange (magenta) dots indicate the positive (negative) footpoint, and the red line connecting them indicates the path of the MFR. The Lorentz force is calculated over the cyan dots, and the cyan lines indicate the force direction. Right top panels show, for each case, some field lines of the initial MFR (pink lines) with the context of the selection: the tie-pointed position of the pre-eruptive filament (white dots) for MFR1 (a), the flare ribbons location (dashed orange lines) for MFR2 (b), and the magnetic field (color-coded field lines) derived from the NLFF model for MFR3 (c), and MFR4 (d). Bottom panels (e)–(h) show the magnetic field lines of the MFRs in the early evolution, and the cyan arrow indicates the apex direction of the GCS model from the observations.
Other Images in This Article
Copyright and Terms & Conditions
© 2026. The Author(s). Published by the American Astronomical Society.