

Image Details
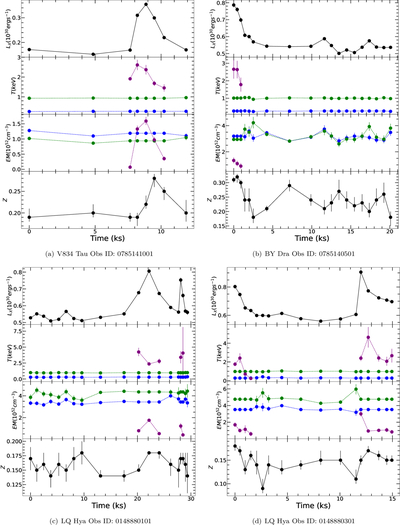
Caption: Figure 3.
Evolution of spectral parameters with time. The first panel of each plot shows the variation of X-ray luminosity in the F band. The second and third panels show the evolution of the temperatures and corresponding emission measures (EMs). Here, green and blue represent the hot and cool quiescent components, respectively, while purple denotes the flaring components. The last panel shows the variation of the average coronal abundances with time.
Other Images in This Article
Copyright and Terms & Conditions
© 2026. The Author(s). Published by the American Astronomical Society.

Copyright ©
2026 Astronomy Image Explorer. All Rights Reserved.
