

Image Details
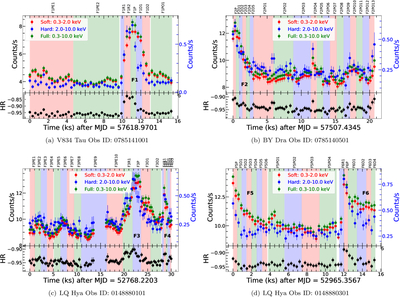
Caption: Figure 1.
X-ray light curves for sample stars in the soft (S, red), hard (H, blue), and full (F, green) bands, along with the hardness ratio (HR) shown in the bottom plots of each panel. The left and right y-axes of the upper panel represent the count rates for the S/F band and H band, respectively. The segments used for time-resolved spectral extraction are shown as shaded regions, with the corresponding labels given in the upper panel.
Other Images in This Article
Copyright and Terms & Conditions
© 2026. The Author(s). Published by the American Astronomical Society.

Copyright ©
2026 Astronomy Image Explorer. All Rights Reserved.
