

Image Details
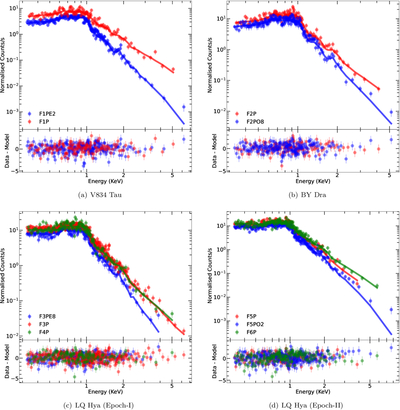
Caption: Figure 2.
The X-ray spectra obtained from the EPIC-pn instrument for the three stars, along with the best-fit thermal-plasma models. The blue spectra correspond to the quiescent phase. The red/green spectra represent the flare peak. For (a) and (c), only one of many quiescent segments is shown for clarity, while the actual quiescent spectrum is the average of all quiescent segments.
Other Images in This Article
Copyright and Terms & Conditions
© 2026. The Author(s). Published by the American Astronomical Society.

Copyright ©
2026 Astronomy Image Explorer. All Rights Reserved.
