Image Details
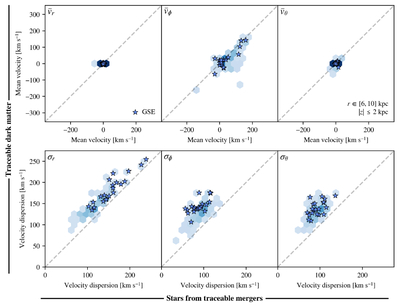
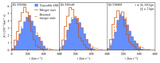
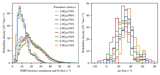
Caption: Figure 5.
Correlation between stellar and DM kinematics for the 108 Traceable mergers. The top row shows the mean galactocentric velocities ﹩{\bar{v}}_{i}﹩ for each of the spherical components, i ∈ {r, ϕ, θ}, while the bottom row shows the velocity dispersion in each of these components. In each panel, the horizontal axis shows the value for the stars contributed by each merger, while the vertical axis shows the value for the DM contributed by the same merger. Equality is indicated by the dashed gray line, such that probability density along this line indicates good agreement between the DM and the stellar tracers. The probability density across the full sample of mergers is shown in the background (blue, with darker indicating higher probability), with the GSE-like mergers highlighted using star markers. Across the sample, the DM and stars have similar mean velocities, with a difference in ﹩{\bar{v}}_{i}﹩ of ﹩(-{1}_{-3}^{+5},-1{5}_{-34}^{+16},{0}_{-6}^{+4})\,\,\rm{km}\,\,{\,\rm{s}\,}^{-1}﹩ for (vr, vϕ, vθ). The velocity dispersions, on the other hand, are shifted: the DM exhibits an offset of ﹩{\rm{\Delta }}\sigma =3{4}_{-11}^{+10}\,\,\rm{km}\,\,{\,\rm{s}\,}^{-1}﹩ with respect to the stars, for Δσ the directionally averaged difference in dispersions (Equation (6)). The dispersions are particularly discrepant (﹩{\rm{\Delta }}\sigma =4{3}_{-10}^{+11}\,\,\rm{km}\,\,{\,\rm{s}\,}^{-1}﹩) for the GSE-like mergers, which are chosen based on their radially biased stars and have lower stellar tangential dispersions relative to the overall population of mergers. The offset in dispersions biases the stellar tracers to predict lower speeds for the DM, as seen in Figure 4, which is corrected for by Equation (5).
Other Images in This Article
Show More
Copyright and Terms & Conditions
© 2026. The Author(s). Published by the American Astronomical Society.