Image Details
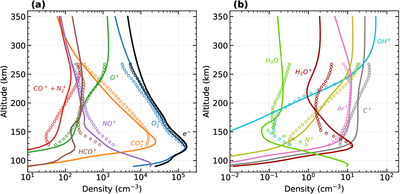
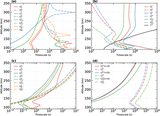
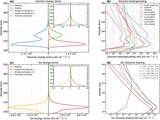
Caption: Figure 3.
Comparison between modeled ion and electron density profiles from the nominal simulation (solid lines) and mean MAVEN NGIMS measurements (open circles) during the DD2 period. (a) Results for O﹩{}_{2}^{+}﹩, O+, CO﹩{}_{2}^{+}﹩, NO+, HCO+, N﹩{}_{2}^{+}﹩, CO+, and electrons. (b) Results for OH+, H2O+, H3O+, Ar+, and C+. Electron densities are derived by assuming charge neutrality. The modeled sum of CO+ and N﹩{}_{2}^{+}﹩ densities is displayed for comparison with the mean NGIMS measurements at the M/Z = 28 channel, where M/Z denotes the mass-to-charge ratio.
Other Images in This Article
Show More
Copyright and Terms & Conditions
© 2026. The Author(s). Published by the American Astronomical Society.
Copyright ©
2026 Astronomy Image Explorer. All Rights Reserved.