Image Details
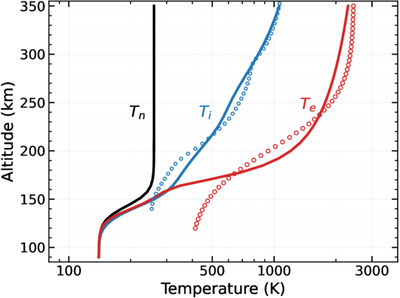
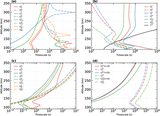
Caption: Figure 9.
Altitude profiles of neutral, ion, and electron temperatures for the nominal model, which includes imposed downward energy fluxes for both ions and electrons at the upper boundary. Solid lines show model results: black for the prescribed neutral temperature (Tn), blue for the ion temperature (Ti), and red for the electron temperature (Te). Open circles show MAVEN measurements for comparison: ion temperatures for ﹩{{\rm{O}}}_{2}^{+}﹩ at SZA ≈ 0° from the STATIC data (K. G. Hanley et al. 2022), and electron temperatures from the recalibrated LPW data (R. E. Ergun et al. 2021).
Other Images in This Article
Show More
Copyright and Terms & Conditions
© 2026. The Author(s). Published by the American Astronomical Society.
Copyright ©
2026 Astronomy Image Explorer. All Rights Reserved.