Image Details
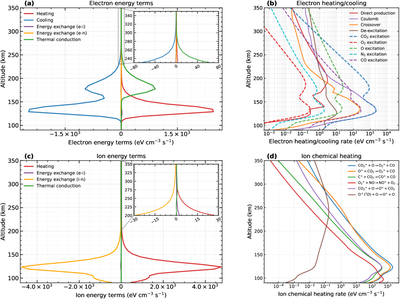
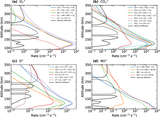
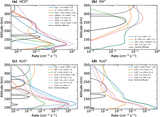
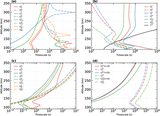
Caption: Figure 10.
Decomposition of the electron and ion energy equations into their principal source and sink terms. (a), (c) Comparison of various electron and ion energy source and sink terms. Color coding denotes the following processes: red for volumetric heating, blue for inelastic cooling (electrons only), purple for elastic energy exchange between electrons and ions (e)–(i), orange for elastic energy exchange between electrons and neutrals (e)–(n) or between ions and neutrals (i)–(n), and green for the divergence of the conductive heat flux. Positive values indicate net heating, while negative values indicate net cooling. Figure insets provide magnified views of the upper-thermospheric regions. (b) Electron heating (solid colored lines) and cooling (dashed colored lines) rate profiles for various channels, including the three components of photoelectron interactions and collisional de-excitation and excitation of various neutrals. (d) Ion heating rate profiles for different ion–neutral reaction channels.
Other Images in This Article
Show More
Copyright and Terms & Conditions
© 2026. The Author(s). Published by the American Astronomical Society.