Image Details
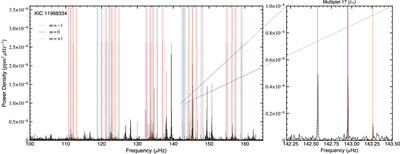
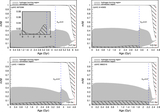
Caption: Figure 9.
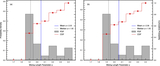
Power density spectrum of KIC 11968334 computed from the Kepler long-cadence photometry. The l = 1 oscillation frequencies listed in Table 6, as identified by E. Corsaro et al. (2015), are indicated by vertical lines: blue dashed lines, red solid lines, and orange dashed lines correspond to the m = −1, m = 0, and m = +1 components of each rotational multiplet, respectively. The shaded region indicates the frequency range shown in the right panel. The right panel shows a zoom-in view of Multiplet 17 (f33; 142.2–143.5 μHz), illustrating a clearly resolved rotational triplet.
Other Images in This Article
Show More
Copyright and Terms & Conditions
© 2026. The Author(s). Published by the American Astronomical Society.
Copyright ©
2026 Astronomy Image Explorer. All Rights Reserved.