Image Details
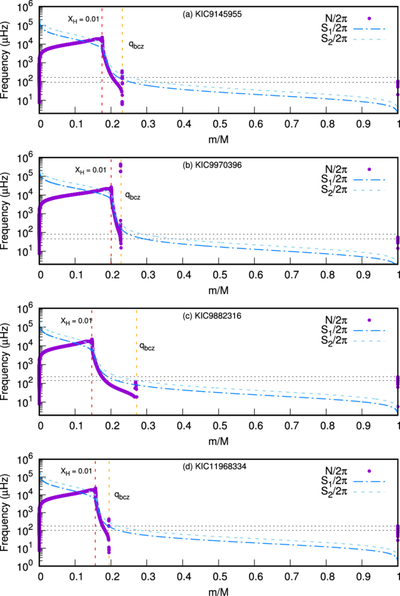
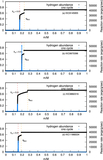
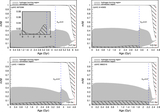
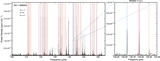
Caption: Figure 4.
Propagation diagram of KIC 9145955, KIC 9970396, KIC 9882316, and KIC 11968334. The vertical red dashed lines in panels (a)–(d) denote the helium core boundary where the hydrogen mass fraction is about 0.01. The vertical orange dashed lines in panels (a)–(d) denote the base of the convection zone, which is marked as qbcz. In panels (a)–(d), two horizontal dashed lines represent the range of observed frequencies. The purple dot indicates the Brunt–V﹩\ddot{{\rm{a}}}﹩is﹩\ddot{{\rm{a}}}﹩l﹩\ddot{{\rm{a}}}﹩ frequency N, and the blue dashed–dotted and light-blue dashed line indicates characteristic acoustic frequency S1 and S2, respectively.
Other Images in This Article
Show More
Copyright and Terms & Conditions
© 2026. The Author(s). Published by the American Astronomical Society.