Image Details
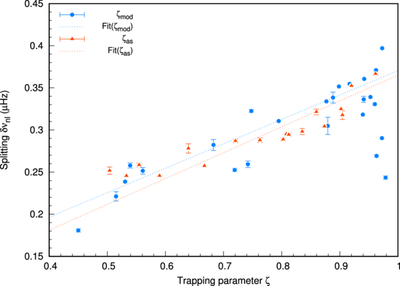
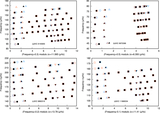
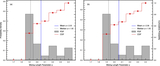
Caption: Figure 10.
Rotational splittings δνn,l as a function of the mode inertia ratio ζ for KIC 11968334. The blue open circles represent the observed splittings plotted against the asymptotic ζas (derived from the period spacing ΔP), while the red triangles show the same splittings plotted against the model-predicted ﹩{\zeta }_{{\rm{mod}}}﹩ (derived from our best-fit MESA model). The solid red line and dashed blue line indicate the weighted linear fits for the model and asymptotic values, respectively. The resulting core rotation rates (﹩{{\rm{\Omega }}}_{{\rm{core}}}﹩) are listed in the legend, showing excellent agreement between the two methods.
Other Images in This Article
Show More
Copyright and Terms & Conditions
© 2026. The Author(s). Published by the American Astronomical Society.