Image Details
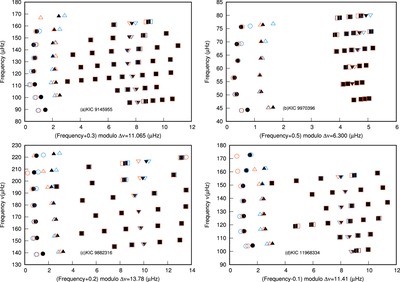
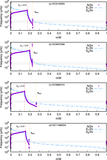
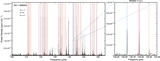
Caption: Figure 6.
Frequency échelle diagrams before and after applying the surface-effect correction of KIC 9145955, KIC 9970396, KIC 9882316, and KIC 11968334. The filled and open symbols denote observational and calculated frequencies. The triangles and circles denote l = 0 modes and l = 2 modes, respectively. The squares and inverted triangles denote the g-dominated and p-dominated l = 1 modes. Blue symbols represent the theoretical frequencies before the surface-effect correction is applied. Red symbols represent the theoretical frequencies after surface-effect correction is applied. The fundamental parameters of these models are presented in Table 4.
Other Images in This Article
Show More
Copyright and Terms & Conditions
© 2026. The Author(s). Published by the American Astronomical Society.