Image Details
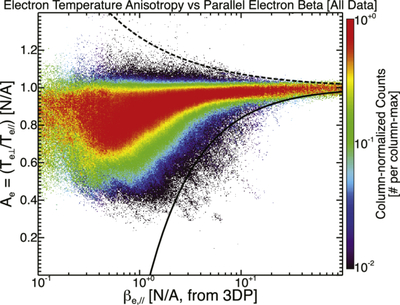
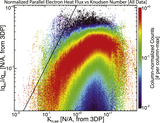
Caption: Figure 5.
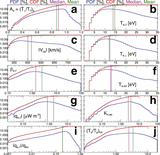
A 2D column-normalized histogram of the electron temperature anisotropy, Ae, [N/A], vs. the parallel electron plasma beta, βe,∥ [N/A]. Note that Appendix B provides Figure 6, which shows the distribution of data for each of these parameters so the reader can properly interpret the statistical significance of any given feature. We have overplotted the whistler anisotropy (dashed line) and electron firehose (solid line) instability thresholds for reference (e.g., S. P. Gary & J. Wang 1996; S. P. Gary & K. Nishimura 2003).
Other Images in This Article
Copyright and Terms & Conditions
© 2026. The Author(s). Published by the American Astronomical Society.
Copyright ©
2026 Astronomy Image Explorer. All Rights Reserved.