Image Details
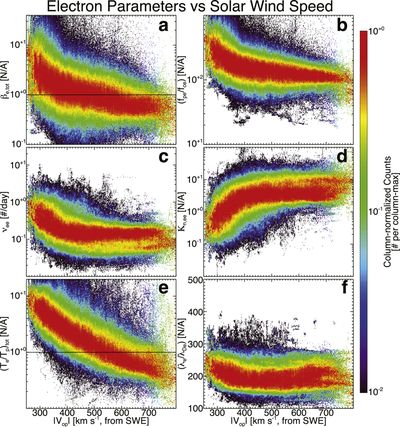
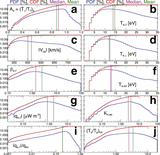
Caption: Figure 2.
Similar to Figure 1, this figure shows various electron parameters vs. the solar wind speed, ∣Vop∣. The panels are as follows: (a) βe,tot [N/A]; (b) ﹩\frac{{f}_{{\rm{pe}}}}{{f}_{{\rm{ce}}}}﹩ [N/A]; (c) νee [# day−1]; (d) Kn,ee [N/A]; (e) ﹩\frac{{T}_{e,{\rm{tot}}}}{{T}_{p,{\rm{tot}}}}﹩ [N/A]; and (f) ﹩\frac{{\lambda }_{e}}{{\lambda }_{{\rm{De}}}}﹩ [N/A]. Panels (a) and (e) show a solid black line at unity for convenience (see Appendix A for symbol definitions). Figure 6 in Appendix B provides a proper statistical reference.
Other Images in This Article
Copyright and Terms & Conditions
© 2026. The Author(s). Published by the American Astronomical Society.
Copyright ©
2026 Astronomy Image Explorer. All Rights Reserved.