

Image Details
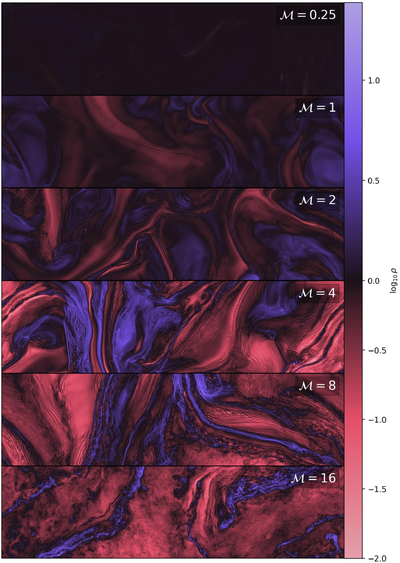
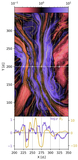
Caption: Figure 5.
Slices of simulation snapshots of ﹩{\mathrm{log}}_{10}\rho ﹩ at tpeak, spanning the x-domain and approximately one quarter of the y-domain, for each simulation in Table 2. All subplots use a shared color scale, in which black represents ﹩\frac{n}{{n}_{0}}=1﹩ and blue (red) represents overdensities (underdensities).
Other Images in This Article
Show More
Copyright and Terms & Conditions
© 2026. The Author(s). Published by the American Astronomical Society.

Copyright ©
2026 Astronomy Image Explorer. All Rights Reserved.
