

Image Details
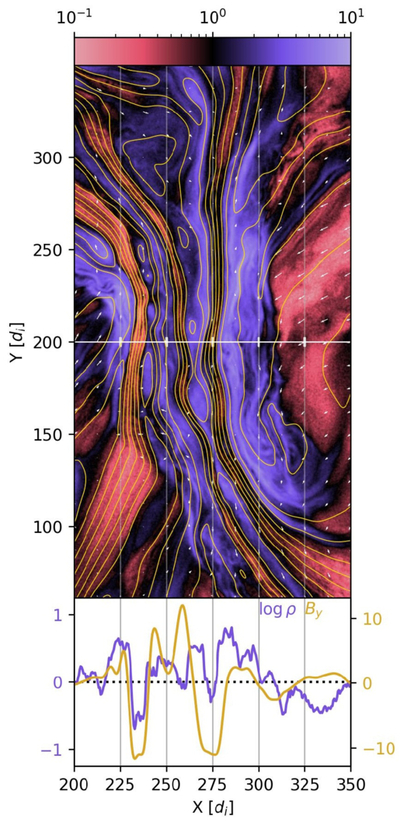
Caption: Figure 9.
Top: a snapshot of the ﹩{ \mathcal M }=8﹩ simulation at tpeak illustrating the complex structures that form in supersonically turbulent simulations. The image is colored on a ﹩\mathrm{log}﹩scale in which regions that are more dense than min0 are blue, less dense regions are red, and values about ρ = min0 = 1 are black. Yellow lines show magnetic field lines, and white arrows indicate the direction and relative magnitude of bulk flows. A white horizontal line is drawn at Y = 200di to show where the cuts plotted in the panel below are taken, and faint white vertical lines are guides to aid in comparing the top and bottom panels. Bottom: plots of ﹩\mathrm{log}\rho ﹩ (blue; left axis) and By (yellow; right axis) as a function of X, where Y = 200di. A dotted black line indicates a value of 0 for both quantities.
Other Images in This Article
Show More
Copyright and Terms & Conditions
© 2026. The Author(s). Published by the American Astronomical Society.

