

Image Details
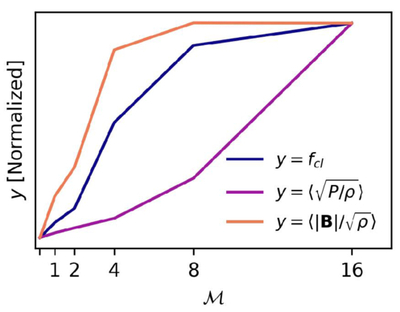
Caption: Figure 8.
Trends of clumping factor (fcl; blue), thermal velocity (﹩\langle \sqrt{P/\rho }\rangle ﹩; purple), and Alfvén velocity (﹩\langle | {\boldsymbol{B}}| /\sqrt{\rho }\rangle ﹩; orange) as a function of Mach number, taken at tpeak. All three are normalized and offset such that the curves start and end at the same point in order to illustrate the trends as a function of ﹩{ \mathcal M }﹩.
Other Images in This Article
Show More
Copyright and Terms & Conditions
© 2026. The Author(s). Published by the American Astronomical Society.

Copyright ©
2026 Astronomy Image Explorer. All Rights Reserved.
