

Image Details
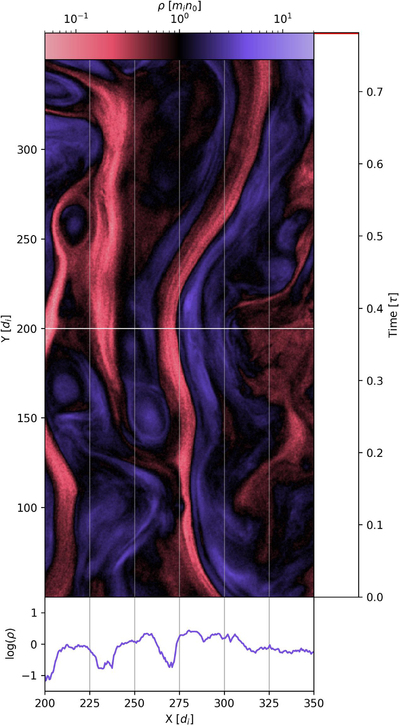
Caption: Figure 17.
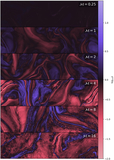
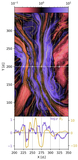
A video showing the evolution of density in the ﹩{ \mathcal M }=8﹩ simulation leading up to tpeak across the structure plotted in Figure 9. Top: each frame is colored on a log scale in which regions that are more dense than min0 are blue, less dense regions are red, and values about ρ = min0 = 1 are black. A white horizontal line is drawn at Y = 200di to show where the cuts plotted in the panel below are taken, and faint white vertical lines are guides to aid in comparing the top and bottom panels. Bottom: plots of ﹩\mathrm{log}\rho ﹩ as a function of X, where Y = 200di. Right: a horizontal red line denotes the time of each frame in units of τ. Early frames each last ﹩{\rm{\Delta }}t=1{{\rm{\Omega }}}_{ci}^{-1}=0.015625\tau ﹩; once structure begins to form, we slow the video, with each frame lasting ﹩{\rm{\Delta }}t=0.1{{\rm{\Omega }}}_{ci}^{-1}=0.0015625\tau ﹩. The static version of this plot shows the final frame of the video. The full animated version of this figure (11 s) can be viewed.
(An animation of this figure is available in the online article.)
(An animation of this figure is available.)
The video/animation of this figure is available in the online journal.
Other Images in This Article
Show More
Copyright and Terms & Conditions
© 2026. The Author(s). Published by the American Astronomical Society.

