Image Details
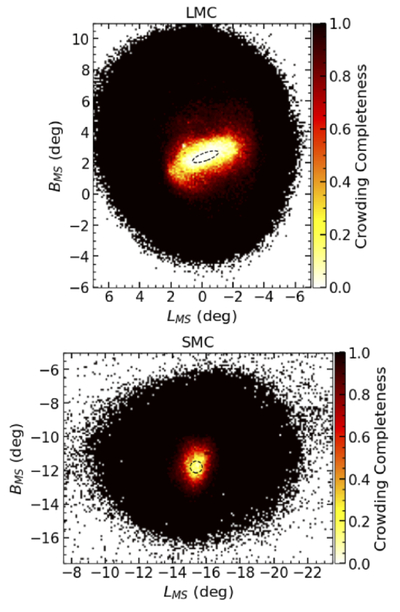
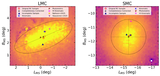
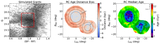
Caption: Figure 5.
Top: crowding-dominated completeness map of RC stars (G ∼ 18.5–20.0 mag) in the LMC. Bottom: same as above, but for the SMC. Values near unity indicate regions where essentially all stars present are detected, whereas values near zero correspond to areas where most stars are missed due to crowding. The dashed ellipse (LMC) and dashed circle (SMC) mark the central regions used to assess potential completeness-driven biases in our RC selection.
Other Images in This Article
Show More
Copyright and Terms & Conditions
© 2026. The Author(s). Published by the American Astronomical Society.
Copyright ©
2026 Astronomy Image Explorer. All Rights Reserved.