Image Details
Caption: Figure 1.
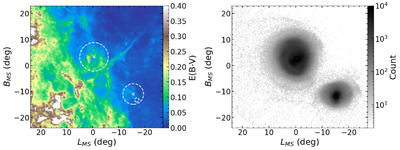
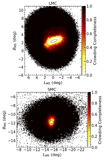
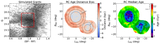
Left: combined reddening map of the MCs plotted in MS coordinates (D. L. Nidever et al. 2008) using a combination of the OGLE-IV map (inner LMC and SMC denoted by the dashed white circles) and the recalibrated SFD map in their outer peripheries. The small circle inside the SMC inner region denotes the 47 Tuc region where we adopt SFD values. This reddening map is publicly available via Zenodo at DOI:10.5281/zenodo.18330362, with the associated code maintained on GitHub at https://github.com/slateroden/XMCreddeningmap, released under the MIT License. Right: 2D density map of the final derived RC sample of the MCs.
Other Images in This Article
Show More
Copyright and Terms & Conditions
© 2026. The Author(s). Published by the American Astronomical Society.