Image Details
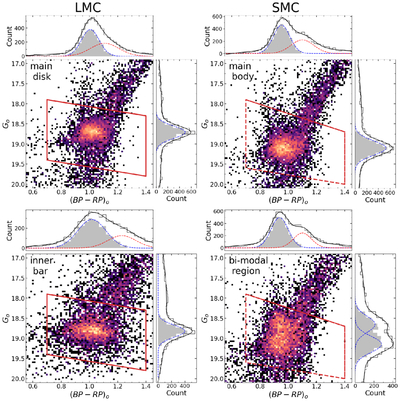
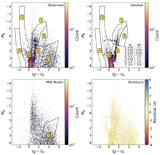
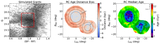
Caption: Figure 3.
Zoomed-in CMDs of representative grid cells showing the selection procedure of Magellanic RC stars. The solid (dashed) red polygons are the limits of the best-fit mean Gaussian(s) in the LMC (SMC). The top marginal histograms show the distribution in (BP − RP)0 color, while the right marginal histograms show the distribution in Gaia G0-band apparent magnitude. The blue (red) dashed lines in the top marginal histograms represent the best-fit color Gaussian components associated with the RC (RGB), while the blue dashed lines in the right marginal histograms indicate the best-fit Gaussian(s) component(s) of the RC in magnitude. The solid black curves show the total combined fits. The solid gray histograms denote the subset of stars selected as individual RC candidates in color and magnitude. Only sources satisfying both criteria are retained as Magellanic RC stars. Top left: example cell in the main disk of the LMC. Top right: example cell in the main body of the SMC. Bottom left: example cell in the dense inner bar of the LMC. Bottom right: example cell in the eastern SMC presenting the bimodal RC population.
Other Images in This Article
Show More
Copyright and Terms & Conditions
© 2026. The Author(s). Published by the American Astronomical Society.