Image Details
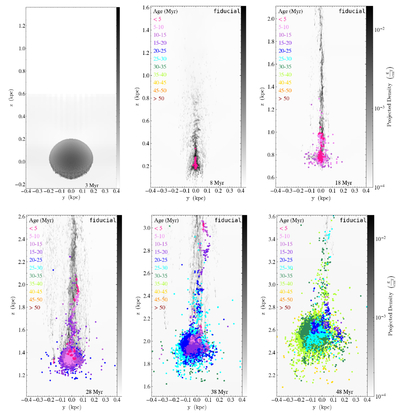
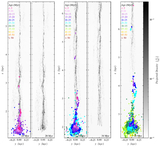
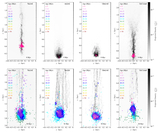
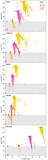
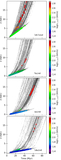
Caption: Figure 4.
A time series of the fiducial run. The grayscale shows the projected gas density and the points show star particles. The particle age determines the color, as shown in the legends. The particles are plotted by age, such that the youngest particles are plotted on the top layer. Each panel is 0.8 kpc by 1.6 kpc. The horizontal axis remains centered on the same position in every projection, but the vertical axis (z position) moves with the main stellar cloud. These panels are focused on the age gradient that can be visually identified in the main star-forming clump.
Other Images in This Article
Show More
Copyright and Terms & Conditions
© 2026. The Author(s). Published by the American Astronomical Society.
Copyright ©
2026 Astronomy Image Explorer. All Rights Reserved.