Image Details
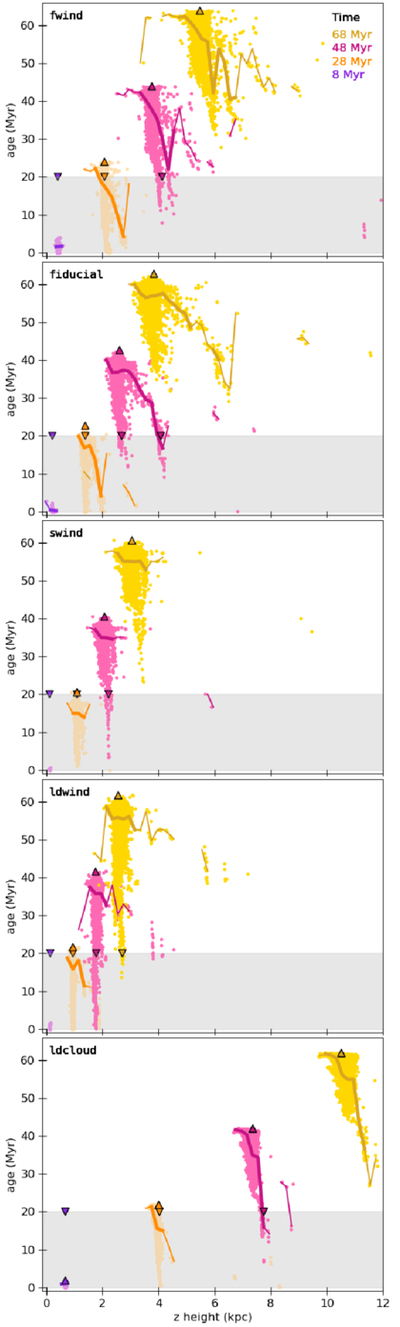
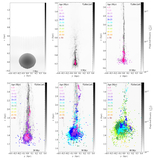
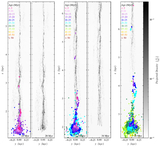
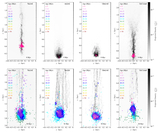
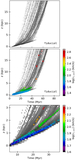
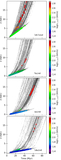
Caption: Figure 7.
Stellar age versus z height at four times in the simulations, plotting all the stars within 12 kpc of the original position of the gas cloud. The mean stellar age as a function of z position is overplotted as a solid line, the mean position of all stars is plotted as an upward-pointing arrow, and the mean position of all stars younger than 20 Myr is plotted as a downward-pointing arrow. All clumps show some age gradient as a function of height, although this is quite minor in both swind and ldwind.
Other Images in This Article
Show More
Copyright and Terms & Conditions
© 2026. The Author(s). Published by the American Astronomical Society.
Copyright ©
2026 Astronomy Image Explorer. All Rights Reserved.