Image Details
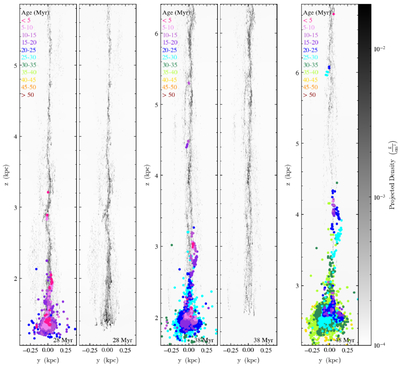
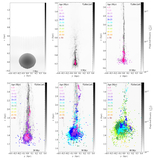
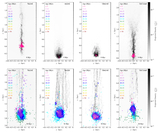
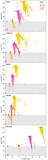
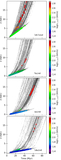
Caption: Figure 5.
A time series of the fiducial run showing 0.8 kpc by 4.8 kpc windows of the last three outputs from Figure 4. The grayscale shows the projected gas density and the points show star particles. The particle age determines the color, as shown in the legends. The particles are plotted by age, such that the youngest particles are plotted on the top layer. The x-axis remains centered at the same position in every projection, but the y-axis moves with the main stellar cloud. The z range of these projections has been chosen to show star particles separating from the main stellar clump as gas is being accelerated as well as stars being formed in the shredded cloud tail.
Other Images in This Article
Show More
Copyright and Terms & Conditions
© 2026. The Author(s). Published by the American Astronomical Society.